Traces & Tracing
Every agent run and every LLM call in Distri is traced automatically, no
setup, no SDK wiring. Each invocation produces an OpenTelemetry trace you can
inspect in the Traces view or with distri traces list: the full span tree,
token usage, cost, latency, inputs/outputs, and which agent (and version)
produced it.
This page covers the concepts, then shows how to invoke, group, name, tag, and filter traces in every language.
Concepts
A trace is a tree of spans for one logical operation. Distri emits these span kinds:
| Span | Emitted for |
|---|---|
Agent (execute) | One agent run, the root of the tree |
| Step / Plan | Planning and per-step execution |
| LLM | Each model call (provider, model, tokens, cost) |
| Tool | Each tool invocation (input/output, success) |
There are two ways to invoke Distri, and both are traced the same way:
execute, run a full agent (planning, steps, tools, sub-agents) over the A2A protocol. Use for agentic workflows.llm_execute, a single LLM turn (optionally with tools). Use for high-volume, single-shot calls like grading, extraction, or classification.
Four things you control on top of the automatic tracing:
- Grouping, make many calls share one trace (e.g. all grading in a run).
- Naming, give the trace a meaningful name instead of
execute {agent}. - Tags, attach
key=valuemetadata you can filter on. - Remote parent, nest Distri's spans under a trace your own service started.
Viewing traces
Open the Traces view in Distri Cloud, or list them from the CLI:
distri traces list                       # recent traces
distri traces list --agent scoring_agent # filter by agent
distri traces list --tag team=growth     # filter by tag (repeatable)
distri traces show <trace-id>            # span tree for one trace
Filtering by --tag narrows the list server-side. For example, after a run
tagged --tag clitest=tagcheck --tag run=demo:
$ distri traces list --tag clitest=tagcheck

  Traces (1 found)
  ──────────────────────────────────────────────────────────────────
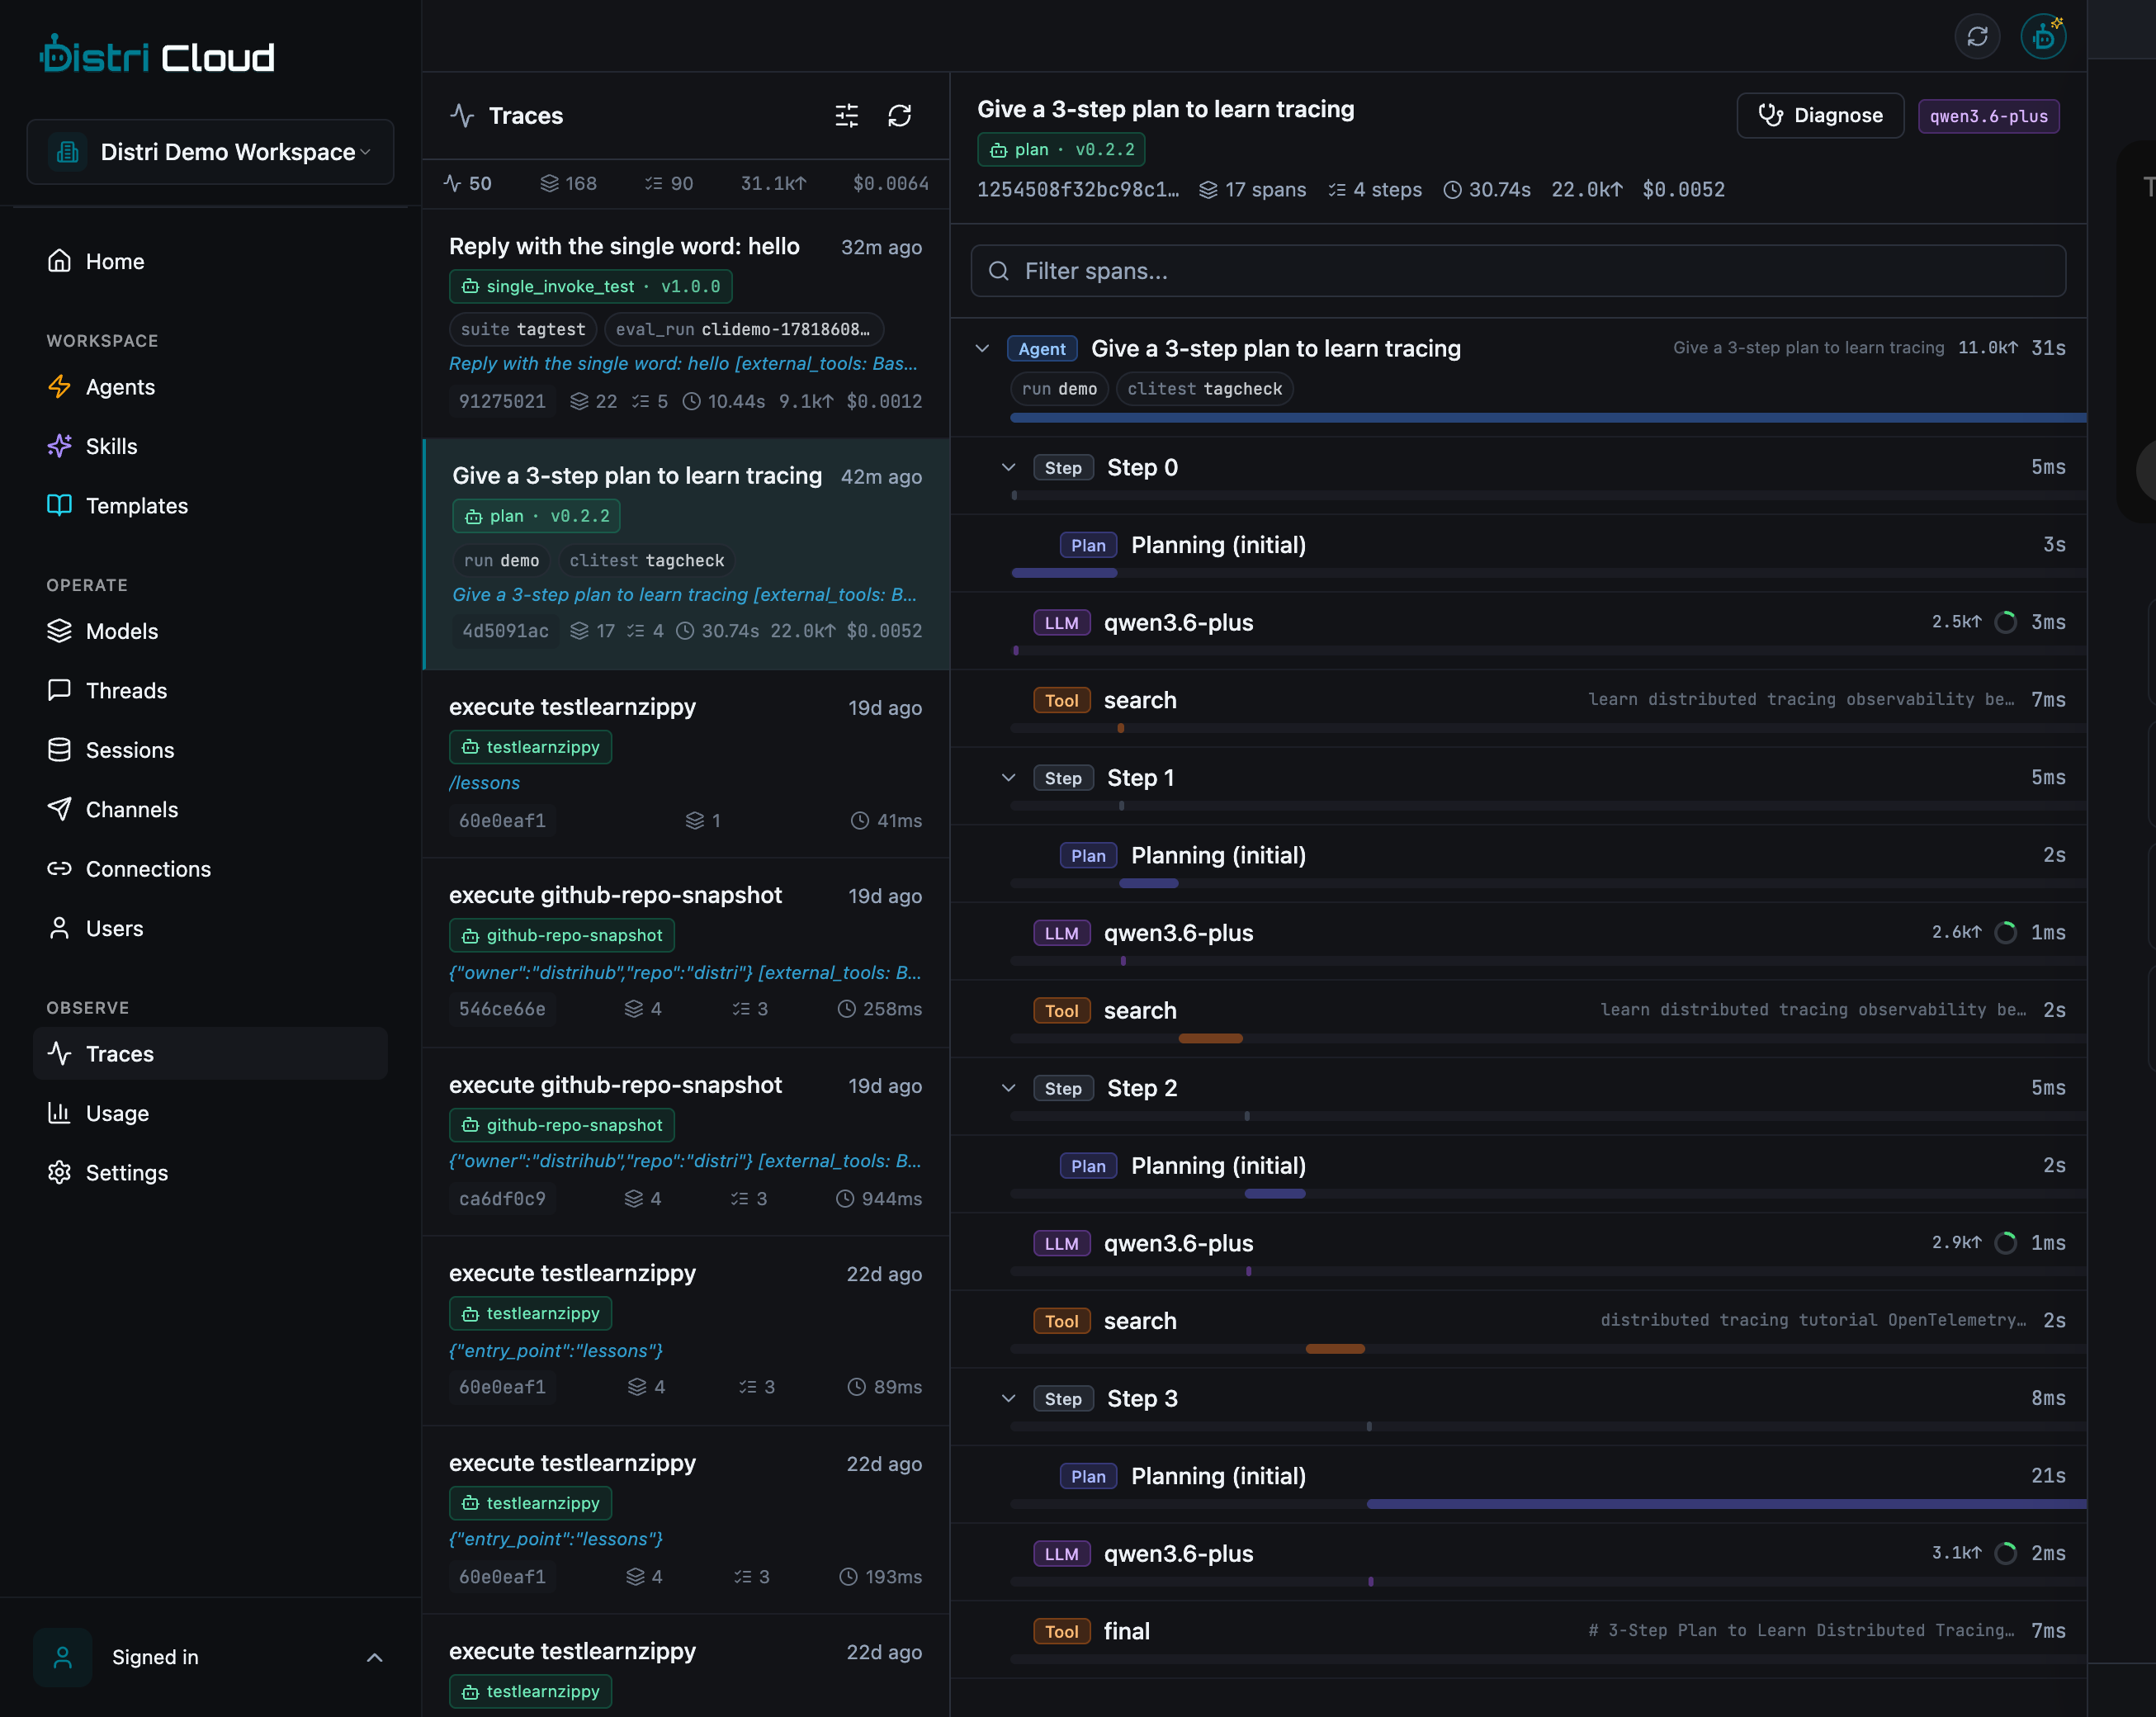
  Give a 3-step plan to learn tracing   17 spans  30.7s  $0.0052  1 min ago
  1254508f32bc98c1e6c4f30764aec460 · 4d5091ac   22.0k tokens
  agent: plan v0.2.2   [clitest=tagcheck run=demo]
  Give a 3-step plan to learn tracing
Each row shows the trace name (from the first message), provenance
(agent: plan v0.2.2), and the tags ([clitest=tagcheck run=demo]), the
same fields you filter and group on.
In the Traces view, selecting a trace shows everything at a glance: the name
(derived from the first message), the agent badge (plan v0.2.2, links to
the agent definition), the tags (clitest, run), and the full span
tree on the right, the agent run, each step, every LLM call, and tools, with
tokens/latency rolled up per span and for the whole trace.
Invoking an agent (execute)
execute is the A2A endpoint POST /v1/agents/{id} (message/send for a
buffered result, message/stream for SSE). Tracing context, tags, and the
remote parent travel in the request metadata; the thread/contextId is the
grouping key.
- TypeScript
- Rust
- HTTP
- CLI
import { Agent, DistriClient } from '@distri/core'

const client = new DistriClient({ baseUrl, apiKey, workspaceId })
const agent = await Agent.create('scoring_agent', client)

await agent.invoke({
  message: {
    role: 'user',
    messageId: crypto.randomUUID(),
    parts: [{ kind: 'text', text: 'grade: 2+2=4' }],
    contextId: `activity-${activityId}`,        // groups by thread
  },
  metadata: {
    tags: { activity_id: activityId, team: 'growth' },   // searchable tags
    // trace_context: { trace_id, parent_span_id },       // optional remote parent
  },
})
use distri::run::{run_agent, RunOptions};
use std::collections::HashMap;

run_agent(&client, RunOptions {
    agent: Some("scoring_agent".into()),
    task: "grade: 2+2=4".into(),
    thread_id: Some(format!("activity-{activity_id}")),   // groups by thread
    tags: Some(HashMap::from([("activity_id".into(), activity_id.clone())])),
    trace_context: None,                                  // or Some(TraceContext { .. })
    ..Default::default()
}, on_event).await?;
curl -X POST https://api.distri.dev/v1/agents/scoring_agent \
  -H "Authorization: Bearer $DISTRI_API_KEY" \
  -H "X-Workspace-Id: $WORKSPACE_ID" \
  -H "Content-Type: application/json" \
  -d '{
    "jsonrpc": "2.0", "id": "1", "method": "message/send",
    "params": {
      "message": { "role": "user", "messageId": "m1",
                   "parts": [{ "kind": "text", "text": "grade: 2+2=4" }],
                   "contextId": "activity-123" },
      "metadata": { "tags": { "activity_id": "123", "team": "growth" } }
    }
  }'
distri run --agent scoring_agent --task "grade: 2+2=4" \
  --tag activity_id=123 --tag team=growth
Single LLM calls (llm_execute)
llm_execute is POST /v1/llm/execute. It runs one LLM turn against a thread.
thread_id is the grouping key; title sets the trace/span name.
- TypeScript
- Rust
- HTTP
const res = await client.llm(messages, tools, {
  agent_id: 'scoring_agent',
  thread_id: `activity-${activityId}`,   // groups by thread
  title: 'Grade Q4',                     // trace/span name
})
use distri::{LlmExecuteOptions, LLmContext};

let opts = LlmExecuteOptions::new(LLmContext {
        thread_id: Some(format!("activity-{activity_id}")),  // groups by thread
        label: Some("Grade Q4".into()),                      // trace/span name
        messages..Default::default()
    })
    .with_agent_id("scoring_agent".into());

let res = client.llm_execute(opts).await?;
curl -X POST https://api.distri.dev/v1/llm/execute \
  -H "Authorization: Bearer $DISTRI_API_KEY" \
  -H "X-Workspace-Id: $WORKSPACE_ID" \
  -H "Content-Type: application/json" \
  -d '{
    "messages": [{ "role": "user", "parts": [{ "kind": "text", "text": "grade: 2+2=4" }] }],
    "agent_id": "scoring_agent",
    "thread_id": "activity-123",
    "title": "Grade Q4"
  }'
Grouping calls into one trace
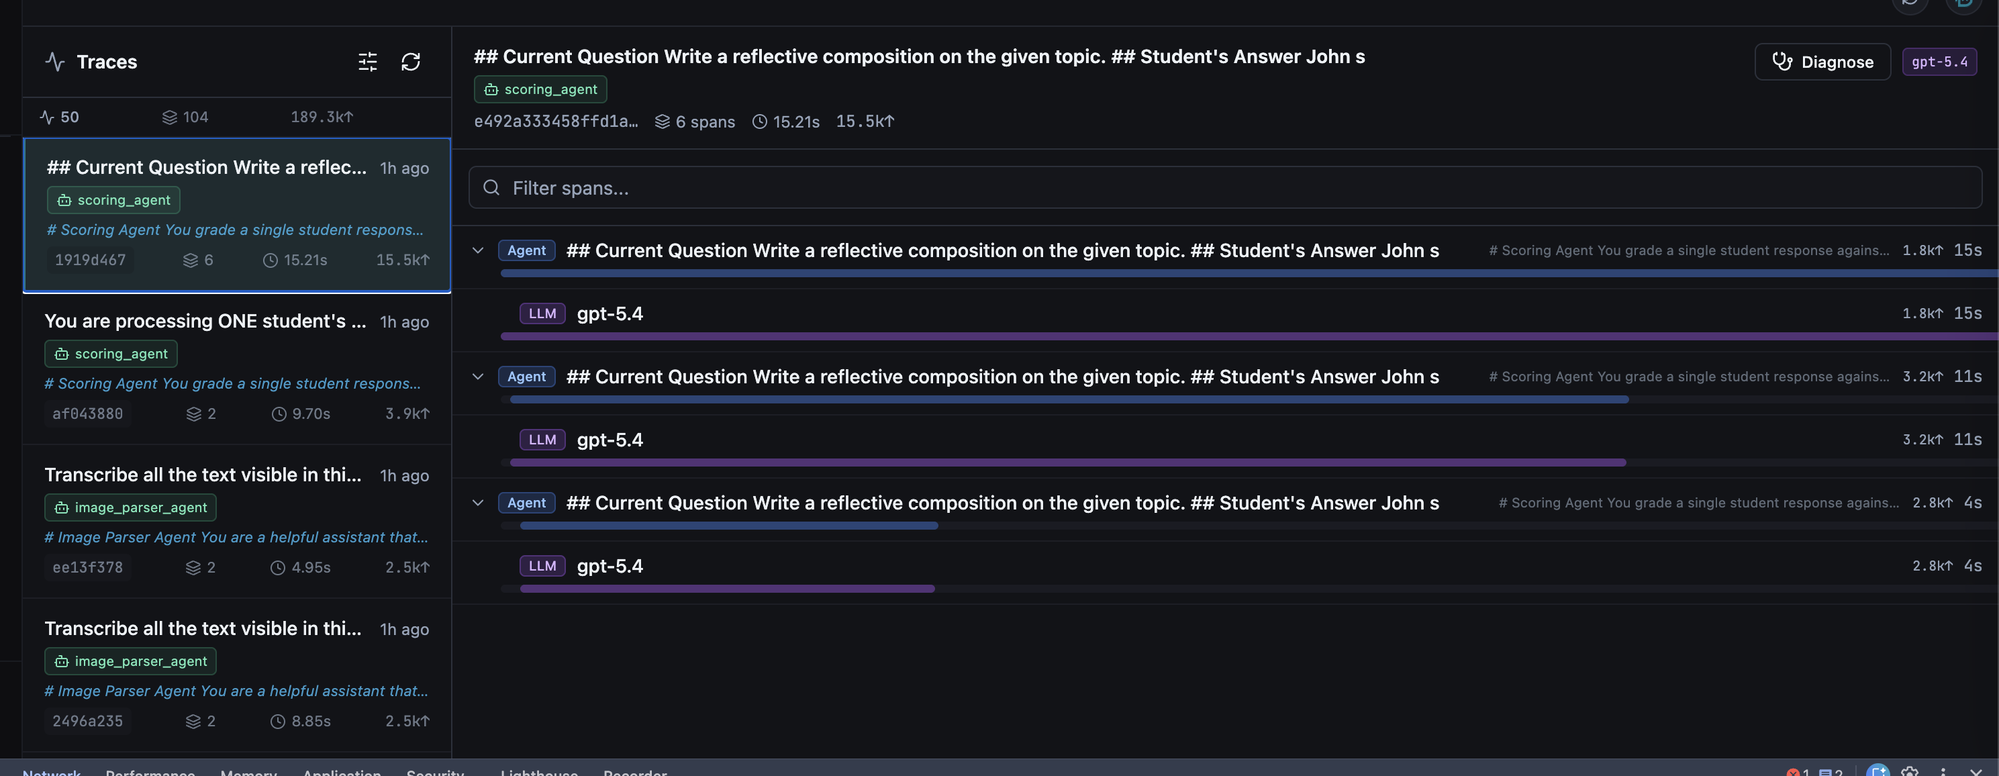
By default each invocation is its own trace. To collapse many related calls (e.g. every grading call in one evaluation run) into one trace, give them all the same thread / context id. Distri derives the trace id deterministically from it, so they roll up into a single trace, one row in the list, every execution nested inside (exactly the screenshot above).
- TypeScript
- Rust
- HTTP
// Every answer of one run shares the activity id → one trace
const contextId = `activity-${activityId}`
await Promise.all(answers.map((a) =>
  client.llm(a.messages, [], {
    agent_id: 'scoring_agent',
    thread_id: contextId,
    title: `Grade ${a.questionId}`,
  })
))
let context_id = format!("activity-{activity_id}");   // shared across the run
for answer in &answers {
    let opts = LlmExecuteOptions::new(LLmContext {
            thread_id: Some(context_id.clone()),
            label: Some(format!("Grade {}", answer.question_id)),
            messages: answer.messages.clone()..Default::default()
        })
        .with_agent_id("scoring_agent".into());
    client.llm_execute(opts).await?;
}
# Reuse the same thread_id (execute) / contextId on every call in the batch
"thread_id": "activity-123"
Tip: pick a stable, meaningful id (
activity-123,eval-run-<uuid>). It also becomes the thread the calls belong to, so it shows up in the Threads view.
The result, many grading calls collapsed into one trace, each Agent span a
single graded answer:
Naming traces
The trace/span name is chosen in this order:
- An explicit name you pass,
title(llm_execute) or the message/run label. - Otherwise a snippet of the first message (e.g. the question being graded).
- Otherwise
execute {agent}.
So passing title: "Grading, Reflective composition (John S.)" gives the trace
a human-readable name instead of execute scoring_agent. No schema or migration
is involved, the name is just the root span's name.
Tags & filtering
Tags are arbitrary key=value pairs attached on execute. They're stored on the
trace and are filterable in the UI and CLI, use them for activity_id,
question_id, class, workspace, team, eval_run, etc.
- TypeScript
- Rust
- CLI
await agent.invoke({
  message: { role: 'user', parts, contextId },
  metadata: { tags: { activity_id: '123', class: 'algebra-1', question_id: 'q4' } },
})
tags: Some(HashMap::from([
    ("activity_id".into(), "123".into()),
    ("class".into(), "algebra-1".into()),
    ("question_id".into(), "q4".into()),
])),
distri run --agent scoring_agent --task "…" --tag activity_id=123 --tag class=algebra-1
Filter by agent and tags from the CLI (or the Agent/Tags filters in the UI):
distri traces list --agent scoring_agent --tag activity_id=123
Cross-process / remote parent
When a service of yours already owns a trace and you want Distri's spans to nest
underneath it (instead of starting a new trace), pass an explicit
trace_context on execute:
"metadata": {
  "trace_context": { "trace_id": "<32-hex>", "parent_span_id": "<16-hex>" }
}
The agent's root span and all descendants inherit that trace_id, so the work
shows up inside your caller's trace.
Reference
| Field | API | Purpose |
|---|---|---|
contextId / thread_id | execute / llm_execute | Grouping, same id → one trace |
title / label | llm_execute | Name the trace/span |
tags | execute (metadata.tags) | Searchable key=value metadata |
trace_context | execute (metadata) | Remote parent ({ trace_id, parent_span_id }) |
| agent id / name / version | automatic | Provenance shown on every trace |